Wednesday, December 22, 2010
Region Of Interest using Optical Flow
Shaking VS Stable
Tracking using Lucas Kanade Optical Flow
the ROI (region of interest) is selected manually by the user
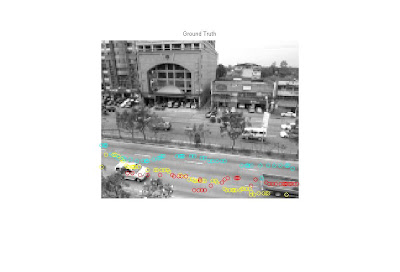
GroundTruth Tracking

ntxy Ground truth

ive used the following code to create a manual tracking using mouse clicks
the following is the code used:
%Ground truth tracking
picnum = 60;
fig = figure;
hold on;
points = cell(1,1);
buttons =1;
while (buttons < 4) %track 3 objects only
tframe=1;
for tframe = 1:picnum
filename1 = sprintf('./video/%d.pgm', tframe);
title('Click the top left corner of an object to track...');
[x1 y1 button] = ginput(1);
points{buttons,tframe} = [x1 y1];
if (button~= 2)
plot(x1, y1, 'rx');
figure(fig)
cla;
imshow(filename1);hold on;
%comment out to remove the need for unwanted empty points in
%the cell
% else
% break;
end
end
buttons=buttons+1;
end
hold off
imshow(sprintf('./video/%d.pgm', 1));hold on;
x=[0 0];y=[0 0];
for i=1:picnum-1
x = [points{1,i}(1) points{1,i+1}(1) x];
y = [points{1,i}(2) points{1,i+1}(2) y];
end
plot(x,y,'y','LineWidth',2);
clear x y;
x=[0 0];y=[0 0];
for i=1:picnum-1
x = [points{2,i}(1) points{2,i+1}(1) x];
y = [points{2,i}(2) points{2,i+1}(2) y];
end
plot(x,y,'r','LineWidth',2);
clear x y;
x=[0 0];y=[0 0];
for i=1:picnum-1
x = [points{3,i}(1) points{3,i+1}(1) x];
y = [points{3,i}(2) points{3,i+1}(2) y];
end
plot(x,y,'b','LineWidth',2);
hold off
Labels:
ground truth,
groundtruth table,
tracking
Subscribe to:
Comments (Atom)