First octave blur progressively

second octave: resize to half the image and blur progressively


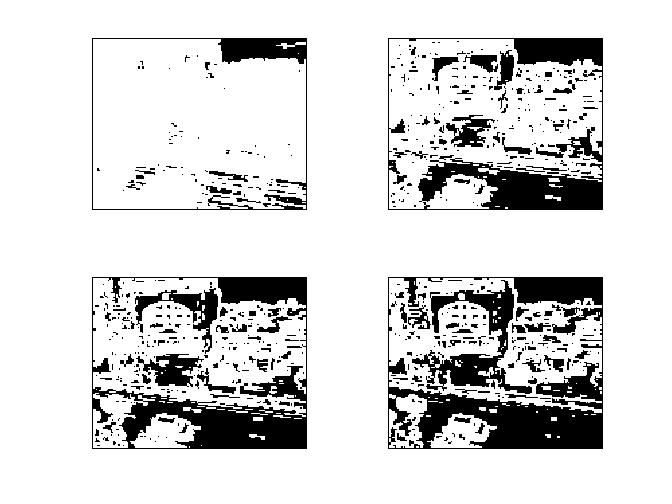
Getting LoG. Subtract image 1 from image 2. Then subtract image 2 from image 3. then subtract image 3 from image 4
 Find the maxima/minima of images from one scale higher and lower.
NOW FOR THE DETAILS:(based on my understanding)
images and details from :
Lowe, David G. “Distinctive Image Features from Scale Invariant Keypoints”. International Journal of Computer Vision, 60, 2 (2004)
Scale invariant feature transform is used for detection and extracting local features of an image.
the steps are as follows:
- Generate a Difference of Gaussian(DoG) or a laplacian pyramid
- Extrema detection from the DoG pyramid which is the local maxima and minima, the point found is an extrema
- Eliminate low contrast or poorly localized points, what remains are the keypoints
- Assign an orientation to the points based on the image properties
- Compute and generate keypoint descriptors
The main SIFT implementation consists of 4 major stages described by Lowe . The first step is finding a scale space extrema. This is done via image pyramids. The process involves repeatedly smoothing an image by convolving it with a gaussian operator and subsequently sub-sampling in order to achieve higher levels of the pyramid. For this stage, Lowe suggests 4 octaves and 5 levels of blur. An octave corresponds to doubling the value of σ.


After obtaining a full pyramid, the difference of each octave results in an approximate solution to the Laplacian of Gaussian.

The amount of blur per interval and octave is very important in obtaining keypoints (matlab source screenshot)

this is a manual computation i did in excel

The next step is to iterate through each pixel and compare it with its 8 surounding neighbors and 9 neighbors at one scale higher and lower. If the pixel value is higher or lower amongst its neighbors then it is considered as a keypoint.
After determining the keypoint, tylor expansion is used to generate subpixel values from the pixel data.

Doing so, will generate a lot of keypoints. These keypoints are low contrast points or points along an edge. To eliminate these points, tylor expansion is used to get an intensity value for each subpixel. It is then compared against a threshold. If the value is higher or lower than the threshold, the point is accepted or rejected. Following this step a series of stable keypoints will be left that are scale invariant. To make the keypoints rotation invariant, a weighted histogram of local gradient direction and magnitudes around each keypoint is computed at a selected scale and the most prominent orientation in that region is selected and assigned to the keypoint.

The orientation of these keypoints are broken into 36 bins, each representing 10 degrees from the 360 degree. After creating the histogram any peaks above 80 are converted to another keypoint with a different orientation.
To do this, check the highest peek in the histogram and get the left and right neighbors. you will get 3 points, fit a downward parabola and solve the 3 equations to get a new keypoint. do this for all octaves and all iterations.

The next step is to produce unique ID’s for each keypoint that will differentiate them from each other. To accomplish this, a 16x16 window is created between pixels around the keypoint. It is then split into sixteen 4x4 windows and an 8 bin histogram is generated. The histogram and gradient values are interpolated to produce a 128 dimensional feature vector which is invariant to affine illumination. To obtain illumination invariance, the descriptor is normalized by the square root of the sum of squared components

The keypoints are now invariant to affine transformation and partial illumination changes.
Although SIFT has been used in the computer vision community for quite some time there are several studies that try to improve on it.